Blog

How accurate is streaming speaker diarization?
Benchmarking pyannote, Deepgram, AssemblyAI, and Speechmatics
Streaming speaker diarization assigns speaker labels, such as SPEAKER_00 and SPEAKER_01, to audio as it arrives, so an application can tell who is speaking while the conversation is still in progress. As we are releasing our new Streaming Diarization models, we want to guide you on how we benchmark the performance of our model against existing ones on the market.
This post is the third in a series about Streaming Diarization. Completing Live-1: From Batch pipelines to real-time intelligence that covers why real-time speaker attribution has become a standard requirement in production voice stacks and traces the path from pyannote.audio to this model, and From research to production: How do we build Streaming Diarization model? that deep dive on how the model was built. Here, the subject is measurement: how streaming diarization quality should be evaluated, and how the systems available today compare on difficult, real-world audio.
That focus is deliberate. Most streaming speech-to-text providers now offer some form of real-time speaker labelling, and they describe it in similar terms. The claims converge; the quality does not. Streaming also makes quality verification harder than for batch, for reasons outlined below. Before comparing systems, it is worth being precise about what is being measured.
How to evaluate streaming diarization quality?
Two metrics matter for a streaming diarization model, and they constrain each other.
Diarization Error Rate (DER) measures accuracy. It is the fraction of audio time the system labels incorrectly, and it decomposes into three components:
False Alarm (FA): speech reported by the system that was not present.
Missed Speech (MISS): real speech that the system failed to attribute to any speaker.
Speaker Confusion (CONF): speech attributed to the wrong speaker.
DER is the sum of these three components, and lower values are better. The decomposition is the part worth attention. Two systems can report the same DER while failing in entirely different ways, and the breakdown shows how a model is wrong rather than only how much. As the benchmark below illustrates, the component that separates these systems is not the same one most people assume. If you want to read more about “How to evaluate Speaker Diarization performance”, refer to our blog: How to evaluate Speaker Diarization performance?
Latency measures responsiveness: how quickly a speaker's turn is reported after it occurs. In a live stack, this is a primary constraint, and it trades against accuracy, because a model can always improve a decision by waiting for more context. The benchmark in this post isolates accuracy and reports DER. Latency is treated separately, since comparing it fairly requires controlling for network path and deployment conditions.
One property of streaming evaluation has no equivalent in batch evaluation: an early prediction can be revised as more audio arrives, so the quality observed in the moment is not always the quality measured once the model has seen the full conversation. A complete evaluation, therefore, has to account for the partial output the application actually consumes, not only a finalized result. The figures reported here are aggregate DER on completed output, which is the standard basis for cross-provider comparison.
Why we benchmark on DIHARD
We evaluate on the DIHARD III dataset. DIHARD is the diarization community's most demanding standard benchmark. It covers eleven domains selected because they are difficult for diarization systems, including clinical interviews, courtroom audio, restaurants, web video, conversational telephone speech, and meetings. It contains substantial overlapping speech, background noise, variable microphone quality, and unscripted multi-party conversation.
These are the relevant test conditions. Clean, single-speaker, studio-quality audio rarely occurs in production, and strong results on such audio say little about behavior on a real call. A model evaluated only on easy material can report a low error rate that does not survive contact with deployment. DIHARD is hard on purpose, and its conditions approximate those that production voice systems meet.
A methodological note, so the figures are read correctly: this is a comparison of real-time, speaker-attributed output across providers, measured on DIHARD without special scoring for overlapped speech. As a result, the absolute DER values are higher than they would be on simpler datasets, for every system in the comparison. The comparison is like-for-like.
Streaming diarization available on the market
We compared pyannote Streaming Diarization against the streaming diarization output of three providers commonly used by builders:
Deepgram (Nova 3)
AssemblyAI (Universal Streaming v3)
Speechmatics (real-time v2)
Results across all languages
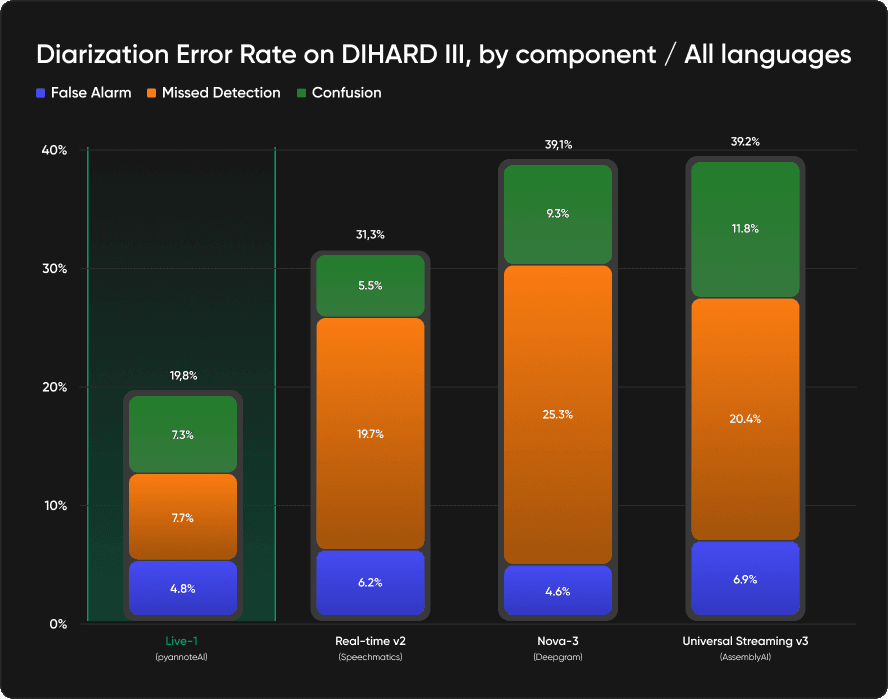
DER across the full DIHARD set, where lower is better:
Model | DER (all languages) | False Alarm | Missed Speech | Speaker Confusion |
|---|---|---|---|---|
pyannote API | 19.8% | 4.8% | 7.7% | 7.3% |
Speechmatics real-time v2 | 31.3% | 6.2% | 19.7% | 5.5% |
Deepgram Nova 3 | 39.1% | 4.6% | 25.3% | 9.3% |
AssemblyAI Universal Streaming v3 | 39.2% | 6.9% | 20.4% | 11.8% |
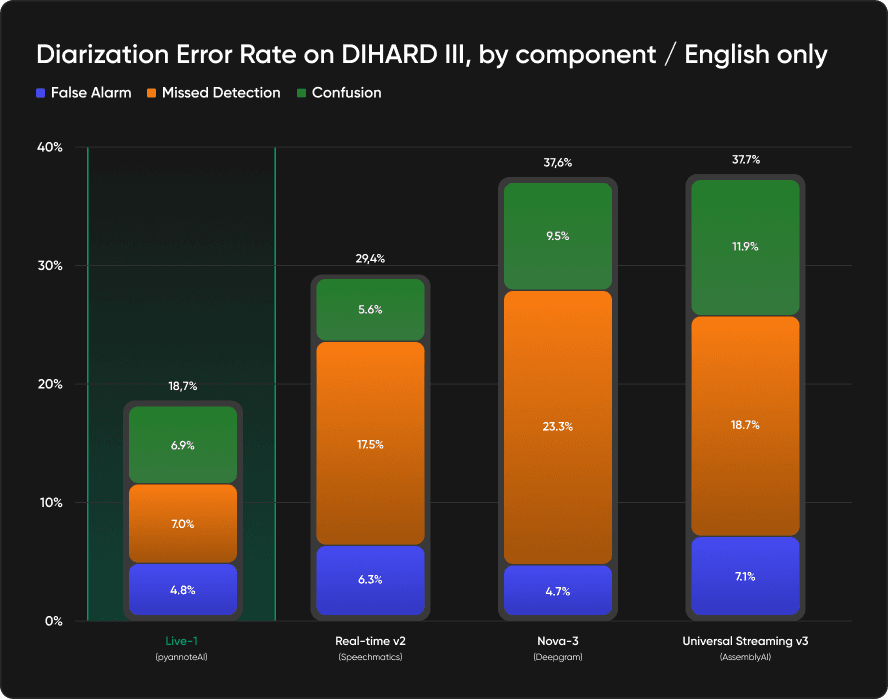
Diarization Error Rate on DIHARD III, broken down by component. Lower is better. pyannote's total error rate is close to half that of the nearest system in both the all-language and English-only sets, and the gap is concentrated in Missed Speech.
The breakdown shows where the difference comes from. Across all languages, pyannote leaves 7.71% of speech unattributed, while the other systems miss between 19.70% and 25.26%, roughly 2.5 to 3 times more. That missed speech is made up of turns lost in overlap, in background noise, and in the difficult acoustic conditions DIHARD contains. pyannote holds a competitive or lower Speaker Confusion rate at the same time, despite detecting far more speech, which is the harder result to achieve, because every additional detected turn is another chance to assign the wrong speaker.
The practical consequence is direct. Speech that a system does not detect cannot be transcribed, cannot be attributed, and cannot be acted on by anything downstream. A high Missed Speech rate is not only an accuracy figure; it is the audio that the rest of the stack never receives.
Performance across domains
An aggregate figure can conceal a model that performs well on easy domains and poorly on difficult ones. That is not the case here. On the English set, pyannote records the lowest DER in all eleven DIHARD domains. Four examples:
Domain | pyannote Live-1 | Deepgram Nova 3 | AssemblyAI Universal Streaming v3 | Speechmatics real-time v2 |
|---|---|---|---|---|
maptask | 7.4% | 27.8% | 34.1% | 23.4% |
conversational telephone speech (cts) | 10.3% | 33.5% | 32.3% | 23.2% |
audiobooks | 4.2% | 11.9% | 15.6% | 11.9% |
clinical | 19.8% | 42.1% | 40.3% | 25.6% |
The most difficult domains, meetings, restaurants, and web video, are hard for every system, and no model records a low DER on noisy multi-party audio of this kind. pyannote still leads each of them: meetings at 44.59% against a range of 58% to 67%, restaurants at 54.43% against 64% to 76%, and web video at 44.83% against 51% to 59%. Performance on the difficult domains is the more informative result, because that is where systems are separated.
Domain | pyannote Live-1 | Deepgram Nova 3 | AssemblyAI Universal Streaming v3 | Speechmatics real-time v2 |
|---|---|---|---|---|
broadcast_interview | 12.1% | 20.8% | 23.5% | 18.5% |
court | 13.8% | 19.6% | 33.5% | 17.1% |
socio_field | 14.4% | 33.8% | 34.2% | 28.2% |
socio_lab | 11.2% | 32.1% | 29.2% | 21.6% |
webvideo | 44.9% | 78.5% | 74.4% | 74.9% |
meeting | 44.6% | 60.9% | 67.0% | 58.1% |
restaurant | 54.4% | 76.3% | 63.7% | 66.3% |
One further detail concerns coverage. pyannote processed every file in the set, 259 of 259. Among the other providers, coverage dropped on the hardest material. A model that does not return output on its most difficult inputs is not robust in the sense production requires, where the inputs hardest to process are also the ones the system has to handle.
Evaluating a streaming solution on your own audio
A benchmark is a starting point, not a conclusion. DIHARD is representative of difficult real-world audio, but the result that governs a deployment decision is the one measured on your own data: your domain, your microphones, your speaker counts, and your latency budget. The recommended next step is to run a candidate model on audio that resembles what it will see in production.
When evaluating, four criteria are worth measuring directly:
Accuracy on your most difficult audio, including overlap, background noise, and recordings you would normally discard. Aggregate accuracy on clean audio is not predictive of field performance.
End-to-end latency is measured through your own network path, not model time reported in isolation.
Behavior as speaker count increases beyond two or three participants, which is where many systems degrade.
Consistency across the full range of your inputs, including whether the model returns output at all on the hardest files.
Streaming Diarization is now available in General Availability.
The documentation includes runnable integration examples, including a worked implementation that combines streaming diarization with a streaming speech-to-text provider to produce a live speaker-attributed transcript. API keys are available from the dashboard.
