Blog

Why evaluate diarization?
Speaker diarization answers the simple-but-crucial question: who spoke when? It segments an audio stream into time intervals and assigns speaker labels (anonymous IDs) to each interval, sitting at the intersection of multiple speech processing challenges.
Diarization is a foundational layer for meeting transcripts, call-center analytics, media indexing, subtitle alignment, and many downstream user-facing products. Unlike simple speech recognition, diarization must handle overlapping speech, varying speaker characteristics, background noise, and dynamic conversational patterns. It must answer not just what was said, but who said it and when.
Why evaluate it carefully? Real-world audio is messy: far-field microphones, overlapping speech, background noise, channel differences, variable speaker counts, and diverse languages and accents all conspire to degrade performance. A diarization system that looks fine on a benchmark can catastrophically fail in production if it was never measured against the right scenarios (e.g., percentage of overlap, far-field vs. headset, telephone vs. meeting audio).
Quantitative evaluation is therefore essential for:
Prioritizing engineering work: know whether you need better segmentation, embeddings, or clustering.
Comparing models fairly: fair apples-to-apples comparisons require clear metrics and protocols.
Predicting user experience: map metric differences to infer user pain (mixed speaker turns, misattributed statements).
We’ll walk through the metrics, datasets, how to read benchmarks, and how to translate metric deltas into user-visible impacts.
Main performance metrics
The diarization research community has converged on several key metrics, each capturing different aspects of system performance: DER, WDER, and JER. Understanding these metrics and their limitations is essential for meaningful evaluation.
Diarization Error Rate (DER)
The Diarization Error Rate remains the gold standard metric for speaker diarization evaluation. DER measures the fraction of time that is incorrectly diarized, combining three types of errors into a single percentage:
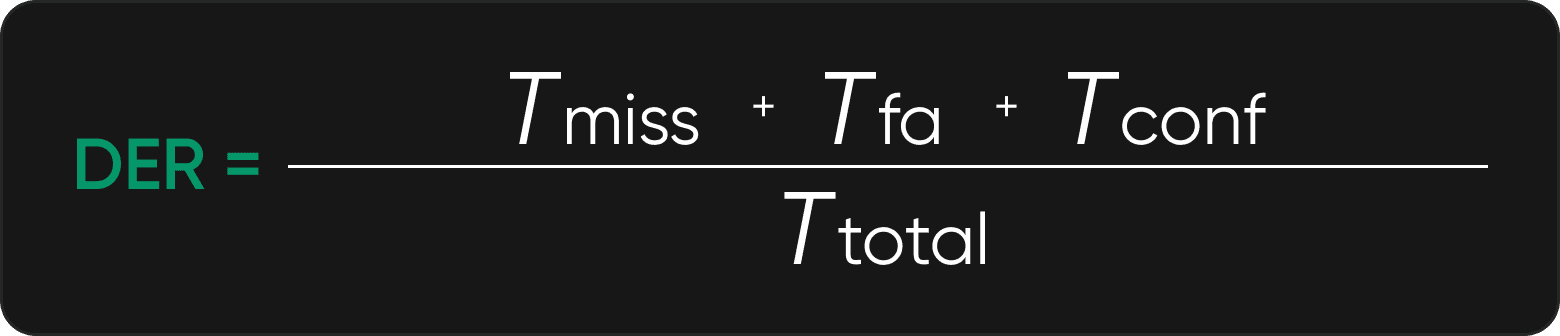
Let's break down each component:
Missed Speech (Tmiss): Reference speech that the system failed to detect. This occurs when a speaker it talking but the system outputs no speech activity for that time period, or when two speakers are talking simultaneously and the system only detects one of them.
False Alarm (Tfa): The system detected speech where none exists in the reference. This typically happens when background noise or non-speech sounds are misclassified as speech.
Confusion (Tconf): Speech was correctly detected but attributed to the wrong speaker. This is often the most damaging error type for user experience, as it makes transcripts misleading rather than merely incomplete.
A DER of 10% means that one-tenth of the total speech time contains errors of these types. Hence the lower the better, with state-of-the-art systems achieving 5-8% on standard benchmarks and 15-25% on challenging real-world data.
A few important scoring conventions:
A tolerance collar (commonly 0.25 seconds) is often applied around speaker boundaries to account for human errors in reference annotations.
Overlapped speech handling varies by protocol: some DER implementations ignore overlaps, while others count them strictly. Always check protocol details.
Word-level DER (WDER)
While DER operates at the frame level (typically 10ms windows), many applications care about word-level accuracy. WDER evaluates diarization quality at word boundaries, making it particularly relevant for integrated ASR + Diarization systems.
WDER is calculated similarly to DER but uses word boundaries from ASR output as the temporal units:
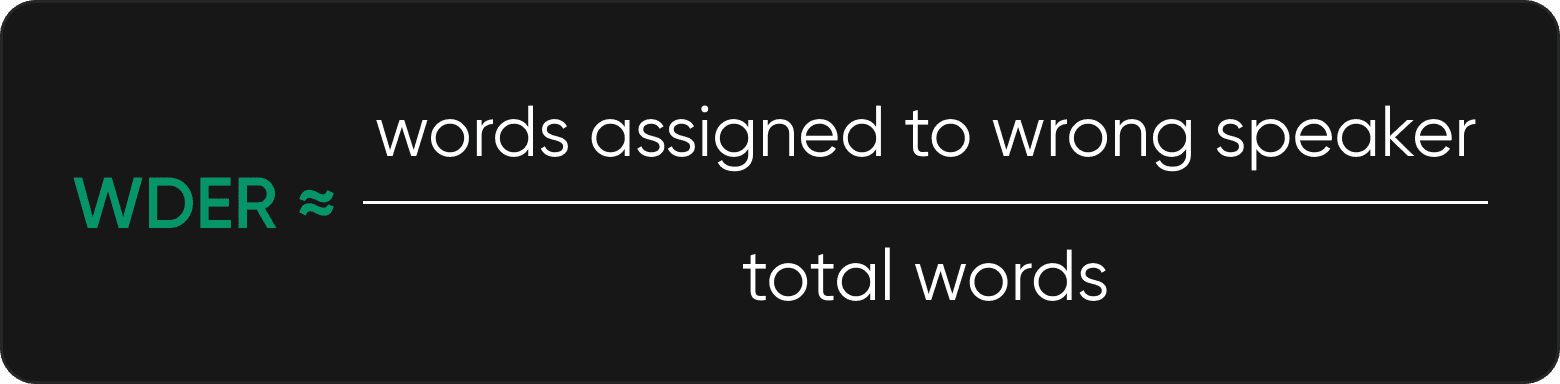
This metric better reflects user experience in transcription applications. A speaker confusion that occurs during a brief hesitation (minimally affecting DER) might span several important words (significantly affecting WDER). Conversely, frame-level errors in silence periods don't impact WDER at all.
The key advantage of WDER is its alignment with how users actually consume diarized content; through transcripts with speaker labels, not abstract temporal segments. However, WDER requires integrated ASR+diarization evaluation, making it more complex to compute and less standardized across research publications.
Jaccard Error Rate (JER)
The Jaccard Error Rate provides a complementary perspective by measuring segment-level accuracy rather than frame-level or word-level accuracy. JER was popularized by DIHARD and is based on the Jaccard index (intersection over union). JER evaluates how well predicted speaker segments overlap with reference segments:
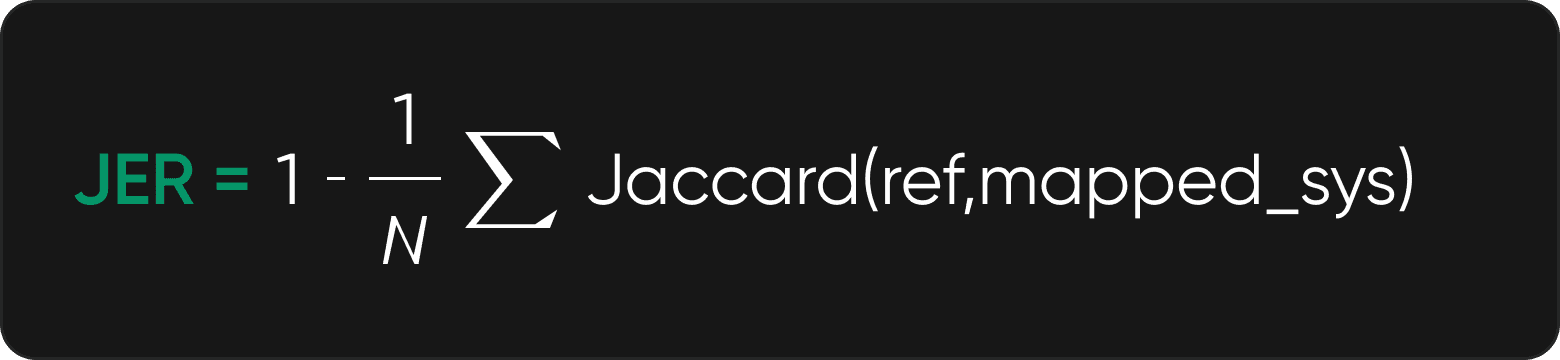
Operationally, JER computes, for each reference speaker, the ratio of missed + falsely assigned time to the union (total) of reference and system time for that speaker. Crucially, JER weights each speaker equally - regardless of how much they speak - making JER more sensitive to errors on infrequent speakers (a desirable property for ensuring fairness).
This makes JER valuable for evaluating systems where segment boundaries matter (i.e., when downstream processing operates on segment-level features, or when users need to navigate through speaker turns). However, JER is less commonly reported in research literature and lacks the standardization DER enjoys.
Choosing the Right Metric
Each metric emphasizes different aspects of diarization quality:
DER provides the most comprehensive and standardized view, making it ideal for research comparisons and general-purpose evaluation
WDER better reflects user experience in transcription applications and should be used when evaluating integrated ASR+diarization systems
JER highlights segmentation quality and is valuable when segment boundaries have downstream importance
Mature evaluation strategies use multiple metrics to understand system behavior holistically. A system with excellent DER but poor JER might be oversegmenting audio; another with low WDER but high DER might indicate good performance on words but poor handling of silence or non-speech sounds.
Metric comparison - when to use which:
DER: default, time-weighted. Used for overall production monitoring and ranking.
WDER: essential when diarization feeds ASR, directly measures user impact on transcripts.
JER: used when per-speaker fairness matters (small speakers matter), or in DIHARD-style, highly variable settings.
Limitations: DER can be dominated by long speakers and obscure errors on brief but important speakers; JER can over-penalize spurious short detections. Use multiple metrics.
Reference datasets
Metrics are only meaningful when applied to representative data. The diarization community has developed several benchmark datasets, each capturing different recording conditions and challenges.
Choosing the right datasets is as important as choosing the right metrics. Common diarization benchmarks include:
AMI (meeting corpus): Multi-party meetings recorded with headsets and distant microphones. Contains 100+ hours with careful speaker labels. Challenges include overlapping speech and multiple speakers. This dataset represents formal meeting scenarios with generally good acoustic conditions.
Benchmark’s common applied use case: Enterprise meeting diarization.
Find it here: groups.inf.ed.ac.uk
VoxConverse: Extracted from YouTube videos, this dataset provides "in-the-wild" conversational data with realistic background noise, music, and acoustic variability. The informal, natural, and diverse recording conditions make it particularly challenging and representative of real-world applications.
Benchmark’s common applied use case: Broadcast and media diarization.
Find it here: robots.ox.ac.uk
CALLHOME: Two-party telephone conversations covering multiple languages. The telephone channel bandwidth limitations and conversational speaking style create unique challenges. This dataset is critical for evaluating telephony applications.
Benchmark’s common applied use case: Call-center scenarios.
Find it here: Hugging Face
LibriCSS: Multi-party conversations in reverberant environments, derived from LibriSpeech. Designed specifically to evaluate robustness to overlapping speech and reverberation, a common challenge in real meeting rooms.
This dataset is more useful for studying overlap percentages and speech separation impact.
Find it here: microsoft.com
DIHARD: The most challenging benchmark, containing diverse domains (meetings, broadcast, clinical interviews, YouTube, etc.) with varying acoustic conditions, speaker overlap, and audio quality. DIHARD performance often predicts real-world robustness better than single-domain benchmarks.
Why dataset choice matters: Recording environment (close vs. far-field), language distribution, number of speakers, overlap ratio, and annotation protocols all change the achievable DER. Benchmarks are proxies: useful for controlled comparisons but not guarantees of production performance. Always validate on a held-out in-domain sample.
Reading and understanding benchmarks
pyannote’s ecosystem provides transparent benchmarking through publicly available results on Hugging Face. Let's examine how to interpret these benchmarks using current performance data as an example.
A typical benchmark table shows DER across multiple datasets:
What these numbers mean: The AMI result (7.2%) indicates that in controlled meeting conditions with headset microphones, the system makes errors on approximately 7% of speech time. As conditions become increasingly challenging - moving to YouTube videos (VoxConverse), telephone calls (CALLHOME), and finally diverse uncontrolled audio (DIHARD) - performance degrades predictably.
This means benchmarks must be read critically: leaderboards often mix different scoring settings (collar, overlap handling, and whether VAD is taught to the system), therefore always check the evaluation protocol.
Concrete example: pyannote publishes diarization pipelines and benchmark results on Hugging Face, with documented experimental setup and recipes to adapt to new domains.
The pyannote/speaker-diarization pipeline pages describe pipeline versions and benchmark protocols, showing how out-of-the-box vs. fine-tuned performance differs. These pages are a good starting point to reproduce published numbers.
Benchmark (last updated in 2025-09) | |||
|---|---|---|---|
12.2 | 11.7 | 11.4 🏆 | |
AliMeeting (channel 1) | 24.5 | 20.3 | 15.2 🏆 |
AMI (IHM) | 18.8 | 17.0 | 12.9 🏆 |
AMI (SDM) | 22.7 | 19.9 | 15.6 🏆 |
49.7 | 44.6 | 37.1 🏆 | |
28.5 | 26.7 | 16.6 🏆 | |
21.4 | 20.2 | 14.7 🏆 | |
Ego4D (dev.) | 51.2 | 46.8 | 39.0 🏆 |
25.4 | 22.8 | 17.3 🏆 | |
22.2 | 20.8 | 10.5 🏆 | |
REPERE (phase2) | 7.9 | 8.9 | 7.4 🏆 |
VoxConverse (v0.3) | 11.2 | 11.2 | 8.5 🏆 |
Diarization error rate (in %, the lower, the better)**
How performance compares to market standards: independent open benchmarks (e.g., Picovoice’s public comparison) show modern open-source pipelines achieve competitive DERs on datasets such as VoxConverse vs. cloud providers, though vendor-reported numbers vary significantly by scenario. AssemblyAI and other providers publish improvements and production metrics showing their diarization performance gains, but remember these metrics are conditional to their data and processing choices. Thus, use such references to derive expected ranges, not guarantees.
Benchmarking ensures reproducibility and transparency: publish code, split datasets, scoring scripts (pyannote.metrics, dscore), and configure the exact pipeline.
Impact on real-world use cases
What does a delta in DER mean in practice?
Small improvements matter: going from 10% DER to 5% DER halves the time users encounter incorrect speaker labels. For a meeting with one hour of total speaking time, that’s 3 minutes of improved, correct labeling and often the difference between a usable and unusable transcript for speaker-attributed minutes:
Consider a 60-minute meeting with 3 speakers:
At 5% DER: Approximately 3 minutes contain errors. Users might encounter a few speaker confusions or missed speaker changes, but the overall flow remains clear and usable.
At 10% DER: 6 minutes of errors. Users now regularly encounter confusing attributions and missing speaker labels. The transcript requires careful review and correction.
At 20% DER: 12 minutes of errors. The diarization output becomes unreliable enough that manual review takes nearly as long as listening to the original audio.
These aren't linear relationships. User satisfaction tends to drop precipitously once DER exceeds 12-15%, as errors become frequent enough to undermine trust in the system.
Contextual factors that change this mapping:
Overlap: Systems that ignore overlap will have inflated DER when overlap is common.
Noise & mic type: Far-field and low SNR recordings degrade embeddings; DER rises.
Language & accents: Models trained on a different language set might yield worse results.
Actionable response: fine-tune segmentation/embedding models on small in-domain labeled data (as little as a few hours). This often yields larger gains than swapping clustering algorithms. Hugging Face + pyannote tooling and community recipes make targeted fine-tuning tractable.
Interpret before acting
Evaluation is not a box-ticking exercise: it’s a product decision instrument.
Pick metrics that reflect your user problem: DER for time-weighted correctness, WDER for ASR-dependent applications, JER when per-speaker fairness matters.
Choose datasets that mirror production: instrumented meeting rooms → AMI/LibriCSS; telephone call centers → CALLHOME; broadcast/media → VoxConverse.
Benchmark transparently: publish protocols, versions, and scoring tools (dscore / pyannote metrics). Reproduce before you trust a number.
Finally: Treat evaluation as a continuous process.
Diarization models affect downstream ASR, VAD, and separation modules: keep measuring end-to-end user impact (speaker-tagged transcript accuracy, manual correction time) and iterate. Good metrics ensure sharp engineering, i.e., rigorous evaluation makes diarization deliver real user value.